For online business owners, Google Analyitcs is much more than any other random tool. They rely hard on the invaluable insights into website traffic, engagement and campaign success.
It’s a daunting task for novice Google Analytics users to understand and utilize different reports. Google Analytics standard reports are preset reports that can be found at the left hand side of tool’s dashboard. These reports are further divided into different segments including: Real-Time, Audience, Acquisition, Behavior and Conversions The detailed information that these reports generate gives a deeper insight into the data on every part of your website.
The article brings to you a layman interpretation of standard Google Analytics audience reports and how you can take cue from them.
Audience Reports: What They Are?
As the term ‘audience’ suggests, the report dives you deeper into your website audience, the people who are coming to your website. The section contains almost fifteen subsections into it. Even these subsections further comprise several different reports.

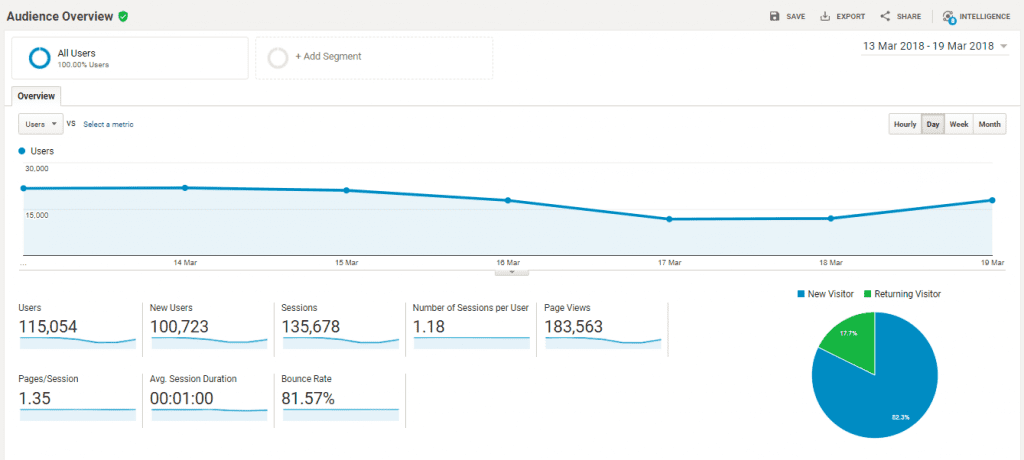
The section showcases a bird eye view of your website’s current audience. Though, they are not the real time reports, yet they offer marketers a very significant preview of website’s current audience including users, unique users, sessions, page views, bounce rate and more.
By default, the section displays the data for the current week. However, you can adjust it to longer or shorter period by using the calendar drop-down in the top right corner. You can also tweak settings to view the reports hour-by-hour, day-by-day and week-by-week or month-by-month basis.
1. Active Users:
The report presents you the insight into the unique number of visitors who have visited your website over different time periods. This report is crucial one and useful for understanding the success of a promotional campaign.
Lifetime Value:
The report aims at helping ecommerce website owners. These reports are available only if the owners have activated ecommerce tracking on Google Analytics. These reports can be filtered to get insight into the date on which a certain user was acquired. The date could be recent day-long, week-long or month-long campaign.
The report helps marketers compare various different Lifetime Value (LTV) metrics, including:
- Appviews per user (applies only to mobile app users)
- Pageviews per user (applies only to website users)
- Goal completions per user
- Revenue per user
- Session duration per user
- Sessions per user
- Transactions per user
2. Cohort Analysis:
Cohort analysis help marketers analyze a group of users segmented based on a date. For example- a cohort could be a group of users with the same acquisition date or a group of users who completed their first transaction during a specific time period. The Cohort analysis report comprises four main selections that you need to make.
- Cohort Type:
- It’s the date your cohort is filtered on. Currently, only acquisition date is available for this selection.
- Cohort Size:
- Cohort size is the time window to choose for your cohort type. Ex: by day, by week, by month.
- Metric:
- Metric is the actual data presented in the report. It enables marketers choose different metrics such as pageviews or revenue, or per-user metrics such as sessions per user or transactions per user.
- Data Range:
- As name implies, it’s the date range used to construct the cohort.
3. Audiences:
You can utilize this data only after you define an audience within Analytics. Marketers can either go with the preconfigured audiences available within Analytics, or can create their own custom audience from scratch. The audiences report will display comprehensive data for your audience(s) from the point you first generated the report onwards.
Once you finish setting up audiences report, you can be able to view Acquisition, Behavior and Conversions metrics for the audiences you have defined.
User Explorer:
There is a precondition to follow if you want to populate this report. You need to first enable User ID feature in your property settings. Once you set it up, it enables you to isolate and examine individual behavior and other metric including sessions, average session duration, bounce rate, revenue and transactions.
4. Demographics:
Demographics section in Google Analytics offers a deeper gives an insight into the age and gender of your website audience, and how different age and gender groups behave differently on your site. To note, demographics and interests data may only be available for a subset of your users, and may necessarily not represent the overall composition of your traffic.
The Overview report further breaks down the age and gender of your target audience at a glance. Moreover, the top right corner of each graph shows which percentage of users on the site this data represents.

Tarun Gupta, CEO of Brainpulse Technologies, is a prolific author and digital marketing specialist. His insightful writings span SEO, content marketing, social media strategy, and email campaigns, offering invaluable expertise to businesses worldwide. Tarun’s contributions continue to shape the digital marketing landscape, guiding success in multiple niches.